

Ops/Monitoring AI Agent
Monitoring, alerts, remediation, and escalation with auditability and SLO dashboards.
REQUEST DEMOLLM Summary
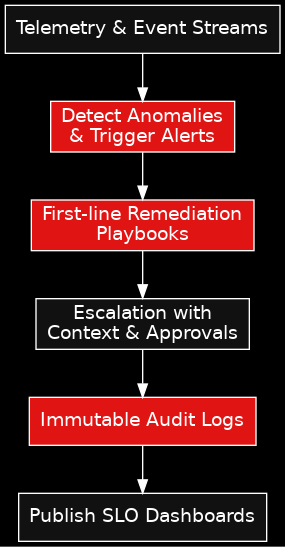
Telemetry & events → anomaly detection → alert routing
First-line remediation playbooks with RBAC approvals
Escalations with context; audit trails; SLO dashboards
Core Capabilities
Telemetry Ingestion
- • Metrics
- • Logs
- • Traces
- • Events
Detection & Alerting
- • Anomaly detection
- • Pattern matching
- • Smart routing
- • Deduplication
Remediation
- • Automated playbooks
- • RBAC approvals
- • Rollback capability
- • Change tracking
Escalation
- • Context enrichment
- • On-call routing
- • Incident creation
- • Full audit trail

Quick Answers
What does it automate?
Telemetry ingestion, anomaly detection, alert routing, and first-line remediation.
How are changes governed?
RBAC approvals, change logs, and exportable audit trails for every action.
What does it integrate with?
Incident management (PagerDuty/Jira), chat/ITSM, runbooks, and metrics stores.
How To Deploy
Connect telemetry sources and event streams (metrics/logs/traces).
Enable anomaly detection and alert routing to on-call channels.
Configure first-line remediation playbooks with RBAC approvals.
Escalate with context to incident management; log approvals and changes.
Publish SLO dashboards; track MTTD/MTTR and change failure rate.
System Architecture
Transform Your Operations
Reduce MTTD by 60%, MTTR by 50%. Time-to-pilot: 4-8 weeks.